


Bitcoin, Uniswap and The Market Cycle
Bitcoin Update
The BTC ETF is the core driver of current price action as Wall Street begins to dip its toes in Bitcoin. The ETF has given Wall Street access to BTC that wasn’t possible before and has abstracted away many of the risks associated with participating in the space into an easy to buy product available in their brokerage account.
The easiest metaphor for traditional investors to get their heads around is the narrative of Bitcoin as digital gold. Same characteristics as gold, but Bitcoin is digital, verifiable, more divisible, more portable, and fixed in supply. It's interesting to note that not only are we seeing significant inflows to the BTC ETF but those flows are coinciding with outflows of the Gold ETFs.
To put Wall Street's interest in context the BTC ETFs now hold more than half the $ value that Gold ETFs hold. Perhaps we are witnessing a rebalancing of Gold allocations to Digital Gold BTC or perhaps buyers are coming from categories of investors who don't have exposure to Gold. One thing is for sure though the BTC ETF has been an incredible success.

Source: MKS PAMP, Bloomberg
Current inflows to Bitcoin ETFs are about 10x the daily newly issued supply of BTC. This snapshot below was taken on the 27th of February. Following the bitcoin halving estimated to occur on the 19th of April, this ratio will go to 20x the daily issued BTC (450 BTC a day), assuming inflows continue at the current rate.

Source: @Matt_Hougan
This is occurring while 56% of BTC is held by wallets that have been inactive for more than 2 years. Consider this: these investors have ridden a 66% drawdown (Feb 22- Dec 22), a quick doubling between (Jan 23- Apr 23), another 21% drawdown (Apr 23- Sept 23) and now the recent 150% rise (Sept 23- Feb 24). These are tenacious and stubborn holders of BTC. One would assume these holders expect much higher prices before letting go of their BTC. The expansionary phase tends to coincide with peaks in BTC held for longer than two years, which seems to be what we are witnessing now.
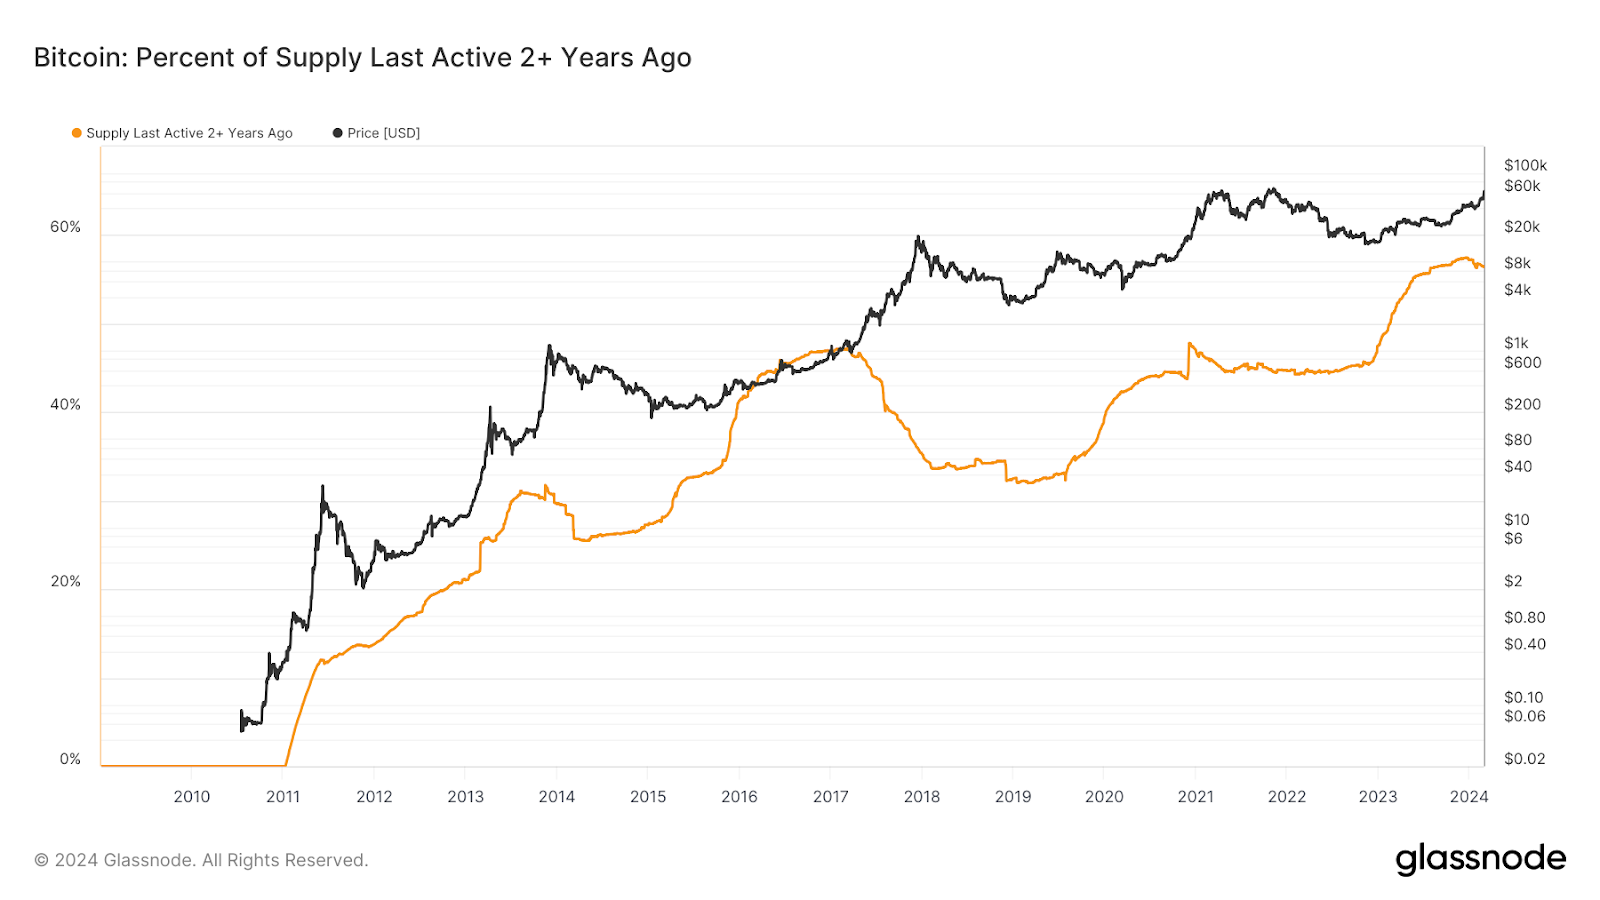
Source: Glassnode
As BTCUSD approaches all-time highs it's worth checking in with BTC on-chain indicators (the fundamental usage metrics) to get a sense of where we are in the cycle. The following charts echo our analysis that we are in the early stages of the expansionary phase.
Reserve Risk is a measure of long-term holder confidence, at current levels it suggests that long-term holders are not selling aggressively into this rally in price. Markets tend to peak when long-term holders get to peak distribution and tend to bottom when they hit peak accumulation.

Source: Glassnode
Puell multiple suggests momentum behind miner earnings. Markets tend to bottom when miner revenue picks up momentum and tend to top out when miner revenue begins to fall.

Source: Glassnode
Net unrealised profit and loss (NUPL) shows we have entered the belief phase of the market cycle. NUPL is a great gauge for percentage of UTXO’s that are in profit versus a loss. The belief stage is the precursor to euphoria and has coincided with the early parts of the expansionary phase in previous cycles. Historically NUPL breaching into euphoria (majority of investors sitting on unrealised gains) coincides with price cycle tops.

Source: Glassnode
Market Value to Realised Value (MVRV) also suggests we are entering the early stage of the expansionary phase. Previous cycle tops have coincided with Market Values of at least 3x Realised Value, whilst cycle bottoms usually coincide with Market Value equal to or less than Realised Value. BTC Market Value is currently 2 times Realised Value, signaling more upside.
Previous cycle tops have seen BTC Market Value trading at 3 times BTC Realised Value, at current prices we are around 2. Suggesting there is still more space to move before market value becomes detached from underlying Realised Value.

Source: Glassnode
Search interest for Bitcoin remains muted, suggesting retail hasn't arrived yet. Once we begin to retest all-time highs of $69k, we could expect this interest to pick up and for retail to return which is another sign we are looking for to signal the expansionary phase. It's also at this point that we believe altcoins will start to outperform BTCUSD and where our “bomb-squad” allocation will start to show meaningful profits.
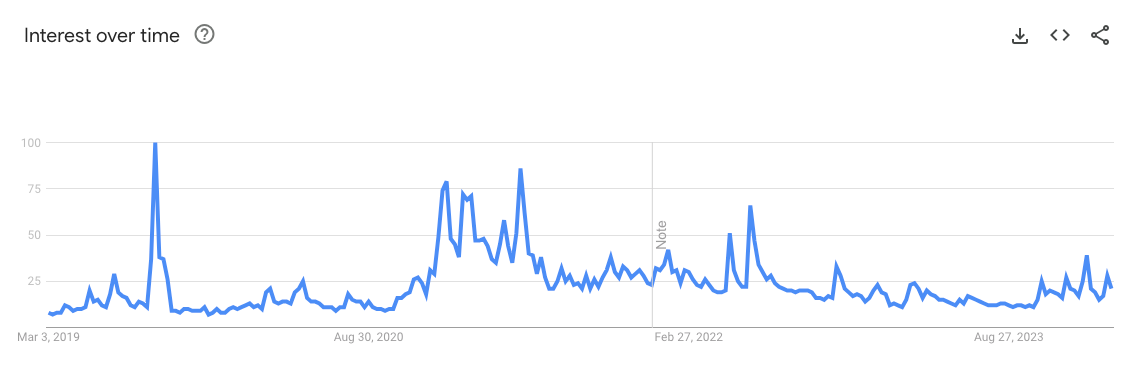
Source: Google Search Trends for Bitcoin
Uniswap Rises from the Ashes
DeFi has been in a bear market since mid-2021. DeFi summer in 2020 preceded a long correction in prices. The cascading liquidations of 2022 didn't help much either, but DeFi remained resilient and managed the correction in an orderly fashion, as one would expect of rules-based financial applications.
2024 may turn out to be a regime change for DeFi. In our view DeFi has been held back significantly by a lack of regulatory clarity, this has manifested itself in business models we like to call “self-licking ice creams”. By self licking ice creams we are referring to reflexive and often self defeating token models employed by many DeFi projects. These token models work well when token prices are going up but begin to unravel when token prices go down. Simpler business models such as those employed by traditional companies can work well and should be implemented for suitable use cases.
Some of the more savvy financial applications such as Uniswap have avoided the self-licking ice cream trap and remained a pure governance token. Governance tokens give tokenholders the right to participate in the future decisions of the project but they lack a path to sustainable value accretion. We have held 2.5% of the fund in UNI, respecting the different approach from Uniswap, and expecting a governance change such as the one that has now been proposed.
A recent proposal on the Uniswap Governance forum triggered a massive 50% rerating in Uniswap’s token price, UNI. The proposal suggests that Uniswap token holders introduce a fee switch. For context, Uniswap is an exchange where you can swap your favourite crypto tokens (aka ERC20 tokens) without needing to 1) give up custody of your tokens and without needing to 2) trust an intermediary to facilitate the exchange.
For this service, Uniswap charges anywhere from 1-30bps of the exchanged value. This entire fee is currently paid out to liquidity providers. The proposal suggests that a portion of these fees should be redirected to participating Uniswap token holders. According to Tokenterminal data Uniswap currently does $1bn in annualised fees. A 5% fee switch would instantaneously start rewarding UNI holders with $50m in fee income.

Source: Uniswap Governance Forum
The fee switch has been on the minds of many UNI tokenholders and the DeFi community at large and the market likes the proposal.

Source: Tradingview
At this stage we believe that it is highly likely that Uniswap Governance approves the proposal however we are unsure of the timeline here. The proposal suggests that a vote will take place on the 8th of March, this is probably an optimistic target for final approval. This is a major step for Uniswap who have been at the forefront of discussions around securities regulation and broader DeFi regulation. If this vote is approved then perhaps there have been some serious victories for crypto in the realm of securities regulations. For context, many DeFi founders refuse to add a dividend-like feature to their project to avoid falling under securities regulations. So to approve such a proposal suggests that risk has been mitigated or at least looking positive.

Source: Cryptofees.io
Uniswap generates meaningful fees, it does more in fees than Bitcoin miners currently earn from maintaining and securing the network. Uniswap probably does more in fees than all the “Ethereum killer” networks put together. So it's safe to say that the approval of the fee switch is meaningful to UNI tokenholders. This is a win for DeFi, for sure, but equally a win for any crypto project or use case that generates consistent cash flow that can be distributed to token holders.
Looking forward
We are currently transitioning from the recovery phase to the expansionary phase, historically this is still a good time to be making allocations. Allocating in this phase is analogous to allocating in March of 2016 or May of 2020.
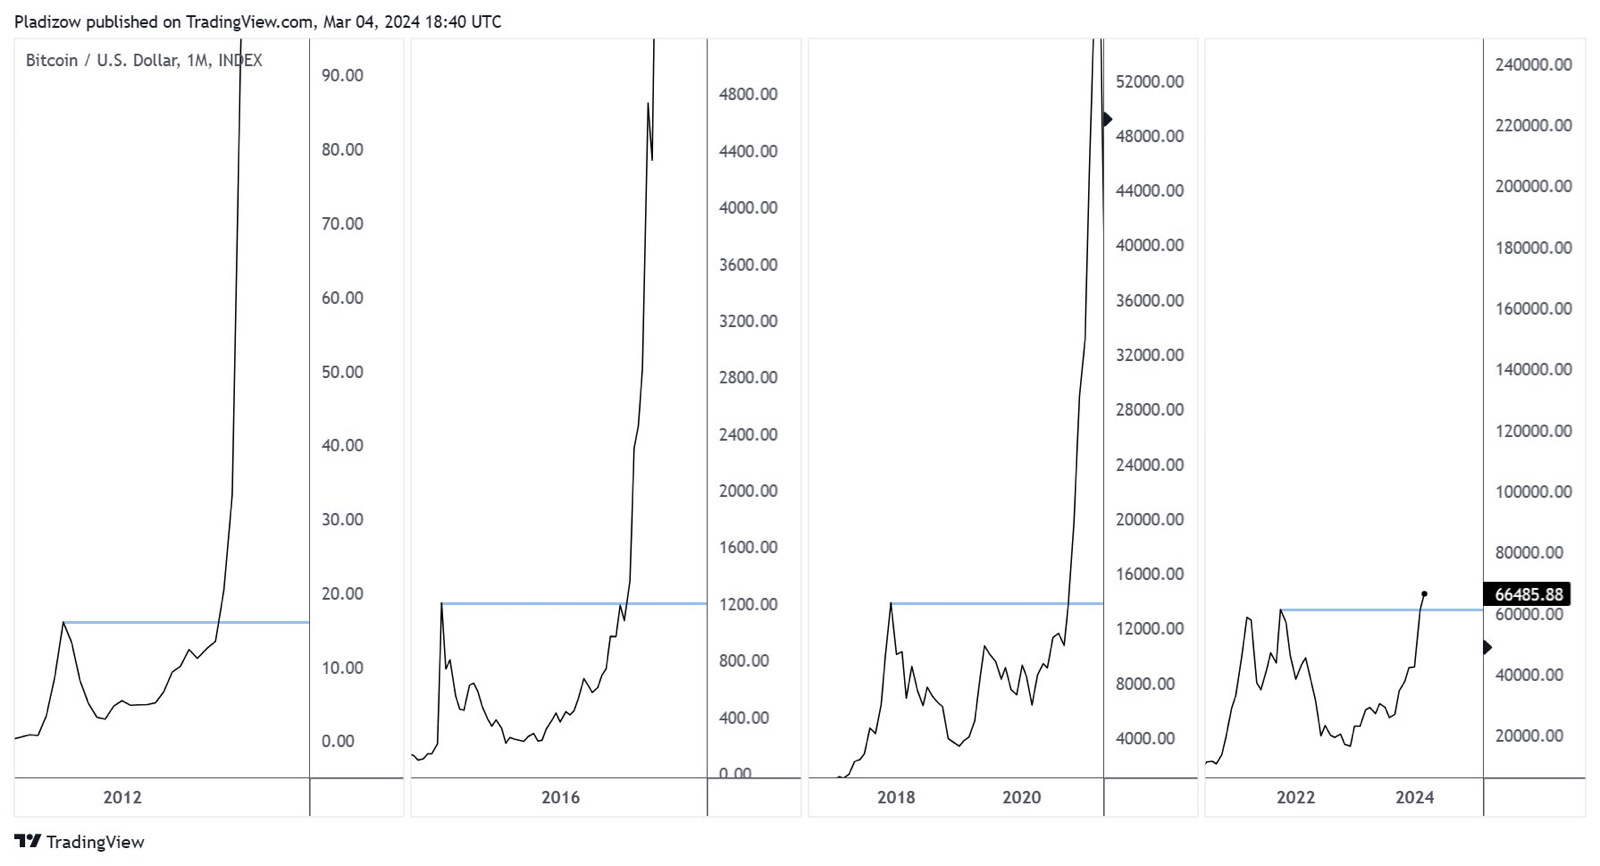
Source: Tradingview, Pladizow
This cycle has displayed an unusually strong recovery phase. BTCUSD reaching all time highs before the halving event is something we haven't seen before.
Source: Coingecko, Etherbridge
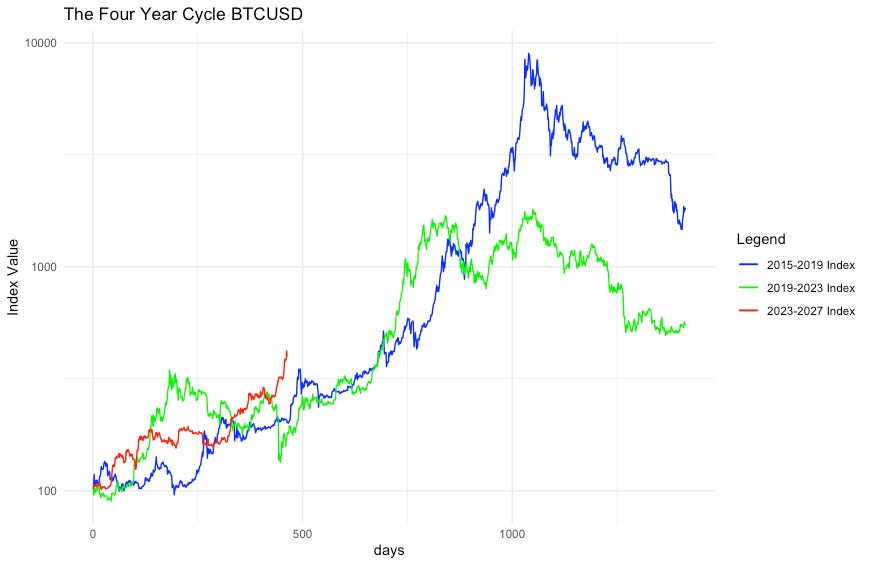
This could suggest that we are in for a shorter cycle and that the market tops well before previous cycle expectations. This scenario could look something like this. We have added historical price action around Bitcoin halvings to the graph below. The green line is the predicted price action if the market follows the same path as the 2017 cycle, and the blue line is the predicted price action if we follow the 2021 cycle.

Source: Tradingview
This compressed cycle (blue line) could see the market reaching its peak as early as December 2024 through to February 2024. The price levels obtained by extrapolating previous expansionary phases are not price forecasts but merely the upper bound of what we believe is possible. They are best guesses of what we can expect to see from here.
Assuming the cycle is uninterrupted and plays out like previous bull markets, the scenario could look something like the following illustration. This projection illustrates a much higher potential upper bound and a much longer bull market that comes to a conclusion around October 2025.

Source: Tradingview
It's important to be realistic when looking at these charts, each market cycle has presented compressed returns (ie returns are lower in successive bull markets), given the growing market capitalisation of the underlying asset. We expect this declining return profile to persist into this cycle.
Excess returns have resembled previous cycles during the recovery phase. Excess returns are generated by altcoins in the expansion phase of the bull market. We are now positioning to capture the relative outperformance of altcoins during the expansionary phase of the market cycle. Excess returns as illustrated below are more often available in this phase rather than in the recovery or contractionary phases.

Source: Coingecko, Etherbridge
With both scenarios in mind we plan to remain positioned to capture this transition to altcoin outperformance and will become more cautious as we near the end of 2024. This would involve more frequent rebalancing of the fund allocations and taking profits on tokens which are at an earlier stage of maturity when compared to larger networks such as Bitcoin and Ethereum. But for now, we are sitting tight in our spot only long positions in the fund. There is potentially still a lot more gas left in the tank of this market.
While it’s easier to look away, seeking to understand is the only path to a more enlightened and empowered world. Bitcoin, Ethereum and distributed ledger technology are complex systems that require due diligence to comprehend and operate in. Etherbridge lowers the barriers to understanding this fast-growing digital economy.
Keep up to date with the world of digital assets by subscribing to the Etherbridge newsletter.

This is not financial advice. All opinions expressed here are our own. We encourage investors to do their own research before making any investments. Collective Investment Schemes (CIS) are generally medium to long term investments. The value of participatory interests may go down as well as up. Past performance, forecasts or commentary is not necessarily a guide to future performance. As neither Lima Capital LLC nor its representatives did a full needs analysis in respect of a particular investor, the investor understands that there may be limitations on the appropriateness of any information in this document with regard to the investor’s unique objectives, financial situation and particular needs. The information and content of this document are intended to be for information purposes only and should not be construed as advice.